Every ten years, the United States counts every person living in the country. That count, run by the Census Bureau, does more than produce a number. It helps decide how much federal money reaches a community for hospitals, fire departments and schools, and how seats are divided in Congress and state legislatures, per USAGov.
The headcount is only the visible part. Smaller, ongoing surveys fill in the details between counts: income, housing, commuting, education. Planners, researchers and local leaders use those numbers to decide where a bus route goes, where a clinic opens, and where a new school is needed. This explainer walks through how census data explained here moves from a form on your kitchen table to decisions about your street.
It also explains what the census does not do. It does not share personal answers for decades, and it does not capture everyone equally. Gaps in the count have real costs for neighborhoods, a problem covered in detail in the census undercount: who is missed, and what it costs their neighborhood. For related coverage, see The census undercount: who is missed, and what it costs their neighborhood.
What is the census, and who has to take part?
A census is a systematic count of the people in a defined area, recording information about them and presenting it as statistics. The word comes from the Latin censere, to assess. As Wikipedia's overview of censuses notes, the United Nations defines the essential features as individual enumeration, universality within a defined territory, simultaneity and defined periodicity, and recommends that countries hold one at least every ten years.
In the United States, the first federal population census was taken in 1790, and it has been taken every ten years since, according to the National Archives. The most recent count was the 2020 census. Participation is not optional: by law, all U.S. residents are required to take part, per USAGov. That requirement applies to everyone living in the country, not only citizens.
The census counts people where they usually live, not where they happen to be on a single day. That distinction matters for college towns, military areas and places with seasonal workers, because the count follows the resident population.
How does the count steer federal funding?
Federal programs use population figures to distribute money. A census response helps determine how much federal funding a community receives, which affects public services like hospitals, fire departments and schools, according to USAGov. The mechanism is simple: many programs divide allocated money across states and local areas using formulas built on population counts and related data.
That means two neighborhoods with the same services but different counted populations can receive different levels of support. A missed household does not just vanish from a chart. It lowers the figure its whole area is measured by, and the formulas follow the figure.
The same counts reach further than budgets. Leaders also use census population data to divide seats in state legislatures and in the U.S. House of Representatives, per USAGov. Population shifts between states change that division, which is why apportionment follows each decennial count.
What happens between the once-a-decade counts?
A once-a-decade headcount would go stale quickly, so the Census Bureau runs a family of ongoing surveys alongside it. The Bureau describes its surveys as providing periodic and comprehensive statistics about the nation, calling the data critical for government programs, policies and decision-making, per the Census Bureau's data portal.
These surveys do different jobs. The decennial census counts everyone. The American Community Survey samples a subset of households each year to estimate things like income, housing costs and commuting patterns. That distinction between a full count and a sample survey is a standard feature of official statistics: a census records every member of a population, while sampling gathers information from a subset, with main population estimates updated between counts through intercensal estimates, as described in the general reference on censuses. A carefully chosen random sample can, in some cases, provide more accurate information than a full enumeration attempt. We covered a connected angle in Eviction records follow tenants for years. More states are sealing them.
The Bureau also publishes targeted datasets: County Business Patterns, population estimates and projections, income and poverty measures, and housing data. One recent example shows how granular this gets. According to the Census Bureau, the Hispanic population's poverty rate fell to 13.9 percent in 2025, down 1.2 percentage points from 2024, the lowest on record even though it remains disproportionately high. The same Bureau reporting noted that the Supplemental Poverty Measure topped the official rate in 26 states and the District of Columbia, with Louisiana among the highest by both measures. Those findings come from the Bureau's own data and stories page.
Who actually uses this data, and for what?
The users are broader than government. The Bureau's data tools, including data.census.gov and Census QuickFacts, let anyone look up figures for a state, county or city, per USAGov. Researchers use the counts as a baseline for designing sample surveys and as a sampling frame, such as an address register. Businesses use the data for planning and marketing. Weighting in opinion polling depends on knowing the relative sizes of population groups, which comes from census enumerations.
Local government is a heavy user. A city deciding where to put a fire station needs to know where people live, how old they are and how the population is changing. A school district projecting enrollment needs the same underlying figures. Emergency planners use population and housing data to prepare for and recover from disasters, a use the Bureau highlights for hurricanes and other events.
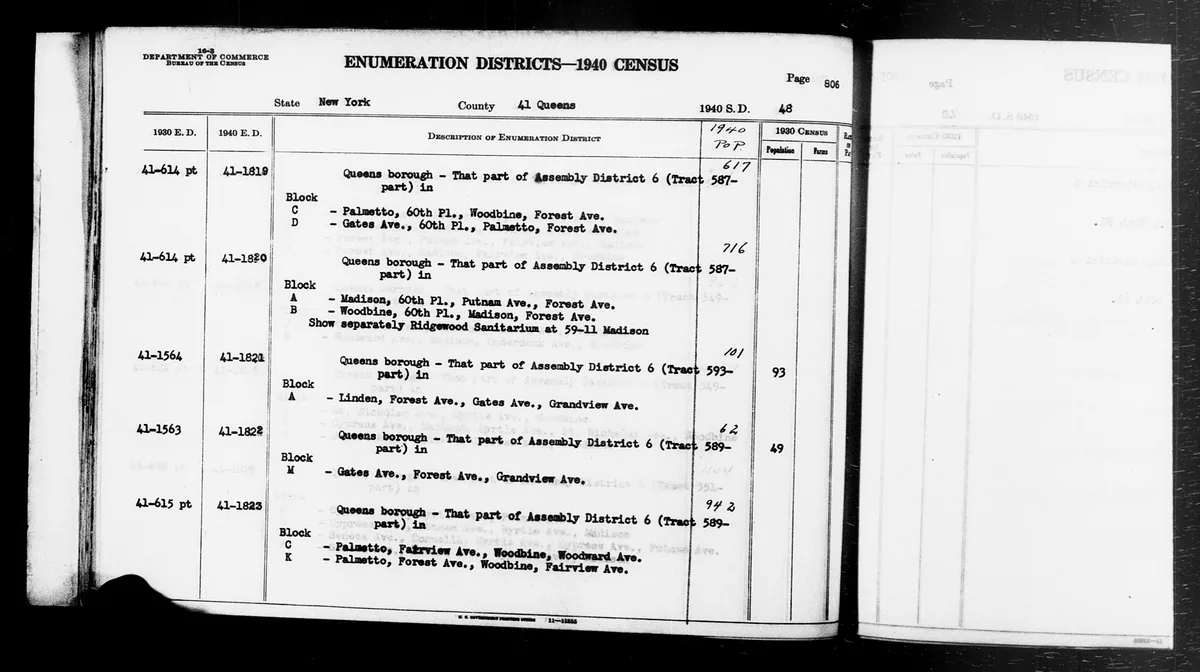
Historians and families use it too, on a long delay. The National Archives holds census schedules from 1790 to 1950, most now digitized, and family researchers often start with the most recent census and work backwards. Because of a 72-year restriction on access, the most recent year available is 1950, which was released on April 1, 2022, per the Archives.
How is personal information protected?
The census collects personal details, and the law protects them. All personal information collected by the census is confidential for 72 years, according to USAGov. That is why the Archives can release the 1950 schedules but nothing later. The Bureau also maintains statistical safeguards and disclosure-avoidance policies designed to keep individual answers from being identifiable in published tables.
Modern data systems raise new questions about this balance. Administrative records can support enumeration with the same level of detail as a traditional census, but they raise concerns about privacy and the possibility of biased estimates, as the general reference on census methods notes. The trade-off between accuracy and privacy is a live policy question, not a settled one.
What this means for your neighborhood
Our analysis of how the system works points to a practical takeaway: the census is infrastructure, and its quality depends on participation. A complete count means funding formulas and district maps rest on an accurate picture of who lives where. An incomplete one shifts resources away from the places where people were missed, which is why undercount research matters to every neighborhood, not only the ones studied.
Three things are well established by the record. The count is mandatory and happens every ten years, dating back to 1790. Its outputs feed funding, representation and planning at every level of government. And personal answers stay confidential for 72 years.
What remains less settled is how well future counts will reach everyone, and how new data methods will change the balance between accuracy and privacy. Those questions will shape the next round of numbers, and the next round of decisions about neighborhoods like yours.