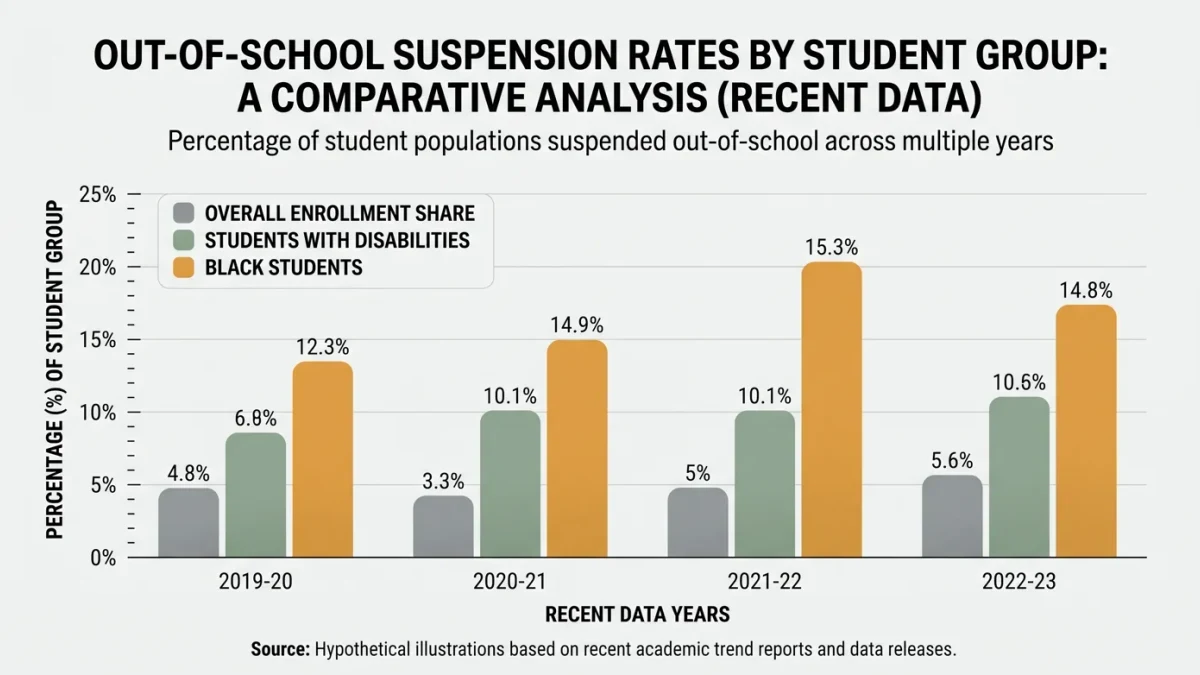
Black students make up about 15 percent of public-school enrollment but receive roughly a third of out-of-school suspensions, a disparity documented in every Civil Rights Data Collection the Department of Education has published since it began counting by race in 1968. The most recent collections, covering the post-pandemic years, show suspension and expulsion rates rebounding after a pandemic dip while the racial gap persisted unchanged: Black students, boys, and students with disabilities remain the most disciplined groups, per the CRDC's school-by-school census. The pattern starts early — preschool suspensions, though small in number, skew heavily Black — and the research connecting it to later justice contact has a name in the literature: the school-to-prison pipeline.
What does the data actually measure?
The Civil Rights Data Collection is a mandatory survey of virtually every public school, counting suspensions, expulsions, referrals to law enforcement, and school-based arrests by race, sex, and disability status. Its limits are known: it counts incidents, not reasons, so a discipline gap can reflect differences in behavior, in how schools respond to identical behavior, or both. But the research that disaggregates those explanations has converged: studies controlling for offense type and poverty consistently find Black students disciplined more harshly for the same conduct, with the gap concentrated in subjective categories — disruption, disrespect, defiance — rather than in violence or weapons. The American Psychological Association's task force report on zero-tolerance discipline compiled the evidence base, and later analyses of states ending discretionary suspensions found no increase in achievement gaps or school violence, undercutting the safety argument for exclusion.
What changed in the 2010s — and since?
The Obama administration issued federal guidance in 2014 putting districts on notice that racially disproportionate discipline could violate civil-rights law, urging alternatives to exclusion; discipline rates fell modestly nationwide. The guidance was rescinded in 2018 by the Trump administration, restored under Biden-era policy, and the direction has cycled with each transition — leaving districts navigating whiplash while state laws, which do not cycle, do more of the work. Several states now ban suspensions for minor defiance in early grades or require restorative practices; California's reforms, tracked by researchers, cut willful-defiance suspensions sharply without measured safety costs.
What is the disability overlap?
Students with disabilities, particularly those with emotional disturbances, are suspended at roughly twice the rate of students without disabilities, per the CRDC, and the intersection compounds: Black students with disabilities carry the highest suspension rates of any measured group. Federal disability law supplies individual protections the discipline statistics often bypass — a manifestation of disability cannot lawfully be punished, and long removals trigger manifestation-determination reviews — but enforcement runs through individual due-process complaints that parents must initiate, which research shows families in high-discipline districts pursue unevenly.
Does discipline predict justice contact?
Longitudinal studies — the most-cited following Texas students through administrative records — find suspension and expulsion predict later juvenile-justice involvement even after controlling for offense behavior, poverty, and prior achievement, with each exclusion raising later contact probabilities. Researchers debate mechanism: exclusion creates unsupervised time, weakens school attachment, and marks students in administrative systems police can query. Juvenile courts themselves have reformed in parallel: referrals from schools for routine misconduct fell in states that formalized separation, and the share of juvenile cases originating on campus has been declining in national caseload data for over a decade.
What are districts doing instead?
The replacement toolkit is restorative conferencing, positive behavioral interventions, and mental-health staffing — all evidence-backed in evaluations, all capacity-dependent, and all slower than a suspension referral. Districts that cut exclusion rates most in the CRDC trend data paired policy changes with teacher coaching and data dashboards that flag classroom-level gaps. The through-line in fifty years of numbers is simpler than any intervention: what schools count, they change — which is why the periodic threats to the data collection itself, raised in budget proposals across administrations, are themselves a civil-rights story.