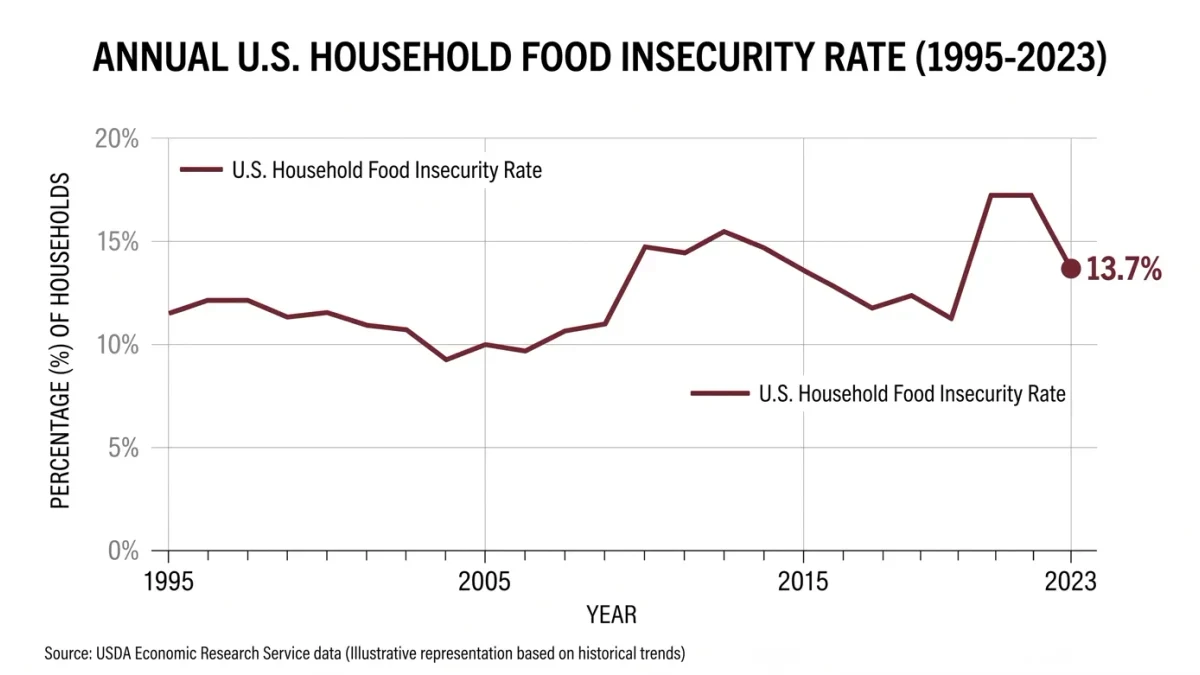
The government's official measure of hunger in the United States is a survey: the Census Bureau's Household Food Security module, fielded as a supplement to the Current Population Survey and published annually by the Department of Agriculture's Economic Research Service. The most recent reports, covering 2023 and 2024, found about 13.5 percent of U.S. households food insecure at some point in the year — roughly 18 million households, including millions with children — the highest levels since the 2015 aftermath of the recession, per the ERS's published series. The number moves benefits policy, drives food-bank budgets, and appears in every congressional farm-bill argument.
What does food insecurity actually measure?
Affordability-driven food access, not calories. The module asks a series of increasingly severe questions over a 12-month window: whether the household worried food would run out, whether food bought didn't last, whether adults skipped meals or ate less because of money, and — in the most severe category, very low food security — whether adults went whole days without eating and children's meals were interrupted. Households are classified by the count of affirmed conditions: food secure, low food security, or very low food security. Critics note what the instrument does not capture: duration, nutrition quality, and the population outside households — homeless people not surveyed by the CPS design at all.
Why does the measure exist?
Because anti-hunger researchers deliberately built it. In the 1980s and early 1990s, hunger advocacy and government fought over whether hunger existed in America — the Reagan-era task force famously found it did but disputed its scale — and the solution was measurement: an expert consensus process in the 1990s produced the standardized module, first published in 1995 and refined by the National Academies' 2006 review. The construction replaced a politically contested anecdote with a repeatable count, which is why the series survived every administration since.
Who is food insecure, per the data?
The disparities are the survey's sharpest findings. Households with children, single-mother households, Black and Latino households, and households below 185 percent of the poverty line run roughly double or more the national rate, per the ERS's detailed statistical tables; geography matters less than income but is real, with the South leading. The child-hunger finding nuance matters: children are usually shielded — adults reduce first — so very low food security among children is rare but concentrated in the poorest tier, and the report's structure reflects that with its child-specific categories.
What programs does the number drive?
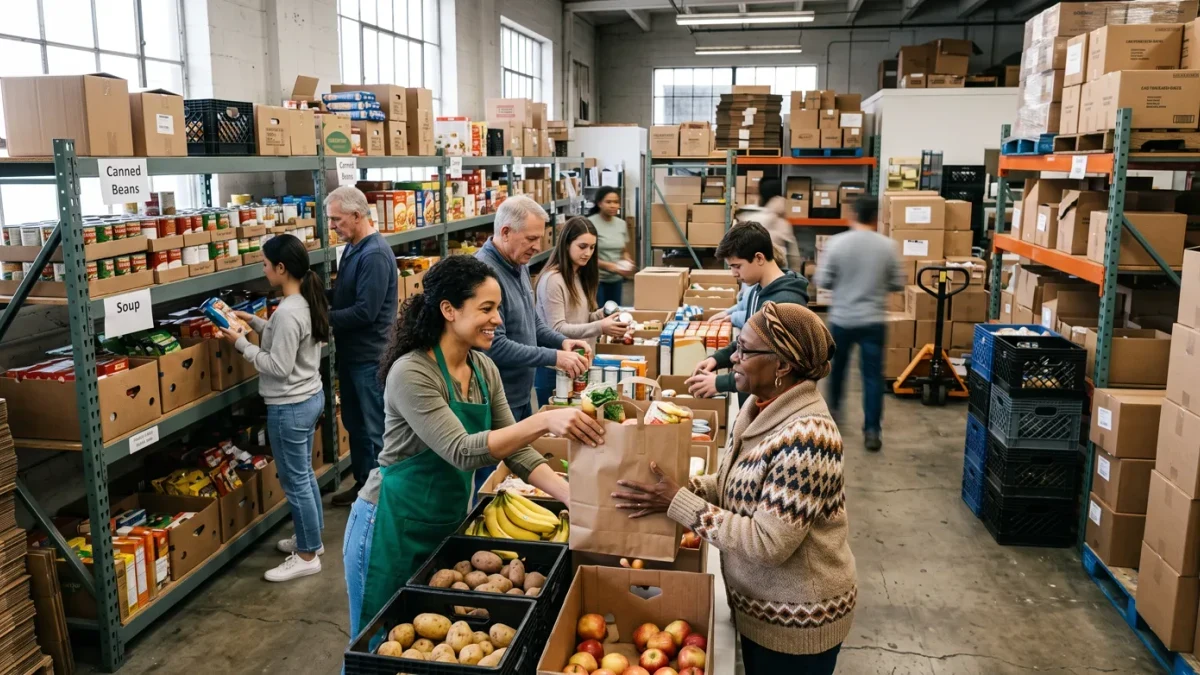
The big three: SNAP, which serves over 40 million people in an average month and whose benefit formula — the Thrifty Food Plan — was revised upward in 2021 on the basis of the food-security research, a change that reduced predicted food insecurity in follow-up studies before pandemic-era emergency allotments ended; WIC, whose participation among eligible people runs well under two-thirds per USDA coverage estimates; and school meals, whose universal-adoption experiments in several states followed research on the programs' measurable effects. The food-bank system — Feeding America's network of 200 banks — runs on the same data, with its Map the Meal Gap project modeling county-level insecurity by combining the federal survey with local indicators.
What are the live measurement debates?
Two. The delay: the survey measures the prior calendar year and publishes near year-end, so policy debates in 2026 argue about 2024 — a lag researchers say shaped the slow response to the 2022-23 rise, which followed the SNAP emergency allotments' end and was visible in real-time food-bank demand data before the official series confirmed it. And the threshold: the module counts 30-day and 12-month windows, and advocates argue the annual framing understates episodic insecurity — households hungry in some months and not others — while the official count averages over the year. The National Academies review recommended supplemental indicators, which the ERS now publishes alongside the headline rate.
What should readers take from the annual release?
That the number is a floor constructed by questionnaire: it counts households reporting money-driven food hardship over a year, misses the unhoused entirely, and arrives late. It remains the only consistent national series — and the fact that it rose while unemployment fell in 2022-24 told the country something about benefit policy that no other dataset could.